
Environmental Monitoring Software or a Spreadsheet? What Each Does to Your Swab Data
By Mthokozisi Nkosi, Food Safety Specialist & Lead Auditor, ASC Food Safety · 24 min read
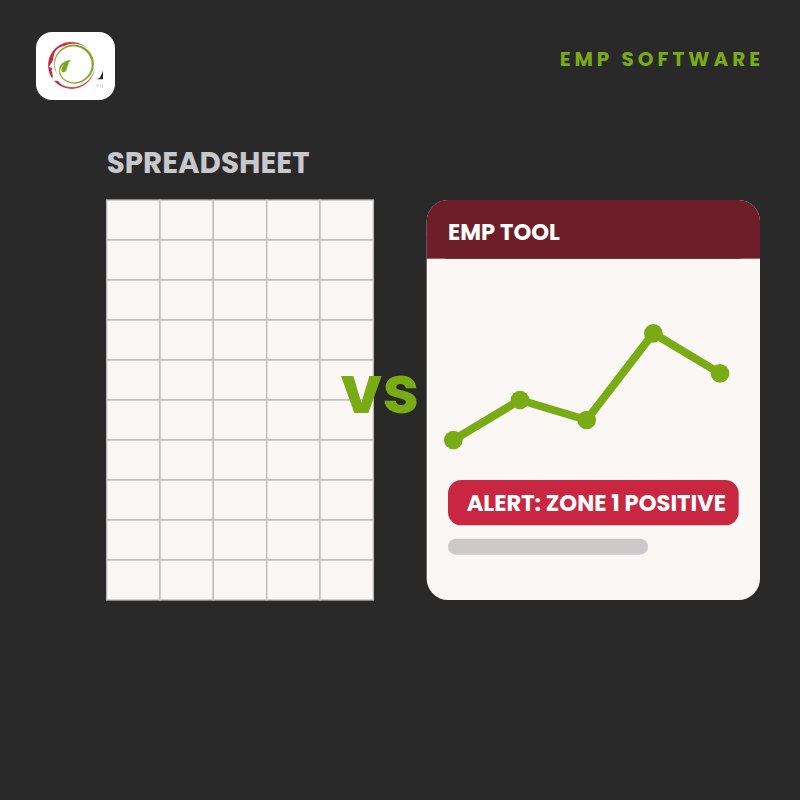
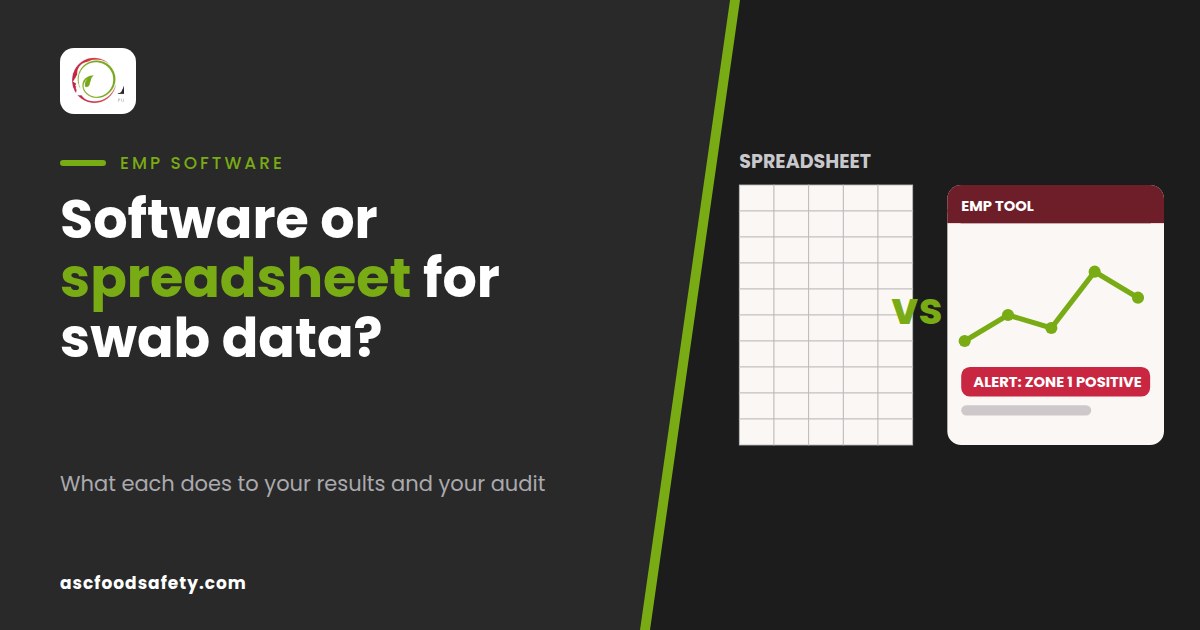
A spreadsheet can run an environmental monitoring programme when the site is small, one careful person owns the file and the trend analysis is done on time. As swab numbers grow, it starts to miss things: nobody is warned when a zone 1 positive arrives, repeat sites are spotted by eye and review triggers are forgotten. Dedicated environmental monitoring software handles those steps for you. ASC’s Automated EMP tool does this in the browser for R1 450 (about USD 89 · EUR 77 · GBP 66 · AED 326) per site per year.
At a glance
- What the standards ask
- A risk based programme, a documented procedure, monitoring data with regular trend analysis, and a review at least once a year and whenever a trigger occurs (FSSC 22000 Version 7 clause 2.5.7)
- Spreadsheet cost
- Usually nothing extra if you already pay for Excel. The real cost is staff time and missed signals
- ASC Automated EMP tool
- R1 450 (about USD 89 · EUR 77 · GBP 66 · AED 326) per site per year, 12 month site licence, runs in the browser, nothing to install
- File based alternative
- RA19 Environmental Monitoring Risk Assessment Template, R690 (about USD 42 · EUR 37 · GBP 31 · AED 155) once off, editable Excel and Word files
- International software
- Most dedicated EMP platforms do not publish prices; the lowest published per site price we found for a general food safety platform is USD 79 a month, billed annually
- Stay on a spreadsheet if
- You run one small site, take a handful of swabs a month and have one disciplined owner for the file
- Training for the users
- Practical Pathogen Environmental Monitoring (EMP) and Surface Swabbing, 9 hours online, R1 750 (about USD 108 · EUR 93 · GBP 80 · AED 394)
Get an email when a zone 1 positive comes in
The ASC Automated EMP tool builds your risk register, sets your swab schedule, logs every result, draws the trend charts and emails the right people when a positive comes in. R1 450 (about USD 89 · EUR 77 · GBP 66 · AED 326) per site per year, working in your browser the day you buy.
In this article
- What do auditors expect from your swab data?
- What does a spreadsheet do well?
- Where do spreadsheets let swab data down?
- What should dedicated EMP software do?
- What does EMP software cost internationally?
- What does the ASC Automated EMP tool do?
- What does the tool not do?
- Spreadsheet vs ASC tool, side by side
- Total cost of ownership in hours
- Moving from a spreadsheet to the tool
- Who should stay on a spreadsheet, and who should buy both?
- Frequently asked questions
What do auditors expect from your swab data?
No food safety standard tells you to buy software. FSSC 22000, BRCGS, SQF and IFS all expect a risk based environmental monitoring programme with written procedures, results that are recorded, trended and acted on, and regular review. Whether that lives in a spreadsheet or a system is your choice; the evidence is required either way.
FSSC 22000 Version 7 clause 2.5.7 is the most specific. Version 7 was published in May 2026, and audits against Version 6 remain allowed until 30 April 2027; confirm with your certification body which version your next audit uses. Version 7 asks for (a) a risk based programme for the relevant pathogens, spoilage organisms and indicator organisms, (b) a documented procedure for evaluating how well your controls prevent contamination from the manufacturing environment, including microbiological controls, (c) monitoring data with regular trend analysis, and (d) a review at least once a year. Item (d) also names events that must trigger an earlier review:
- significant changes to products, processes or legislation
- a long period with no positive results
- a trend of out of specification microbiological results in intermediate or finished products
- repeated detection of pathogens during routine monitoring
- alerts, recalls or withdrawals of the organisation’s products
Three of those triggers (no positives for a long time, a product trend and repeat detections) only show up if someone is analysing the results. A spreadsheet stores the numbers; it will not tell you that the same drain has come back positive three times.
The other schemes say it differently but expect much the same. BRCGS Food Safety Issue 9 covers environmental monitoring in clause 4.11.8. SQF Edition 9 Food Manufacturing covers it in clause 2.4.8, and SQFI says audits before 2 January 2027 are to Edition 9 and audits from that date are to Edition 10. IFS Food Version 8 expects a risk based environmental monitoring programme with defined criteria. For US exports, 21 CFR 117.165 requires written environmental monitoring procedures that identify the test organisms, the sampling locations and number of sites, the timing and frequency, the tests and methods, and the laboratory.
In South Africa, the legal baseline for food premises is Regulation R638 of 22 June 2018, made under the Foodstuffs, Cosmetics and Disinfectants Act 54 of 1972 and enforced by municipal environmental health practitioners. The 2017 to 2018 listeriosis outbreak, traced to ready to eat processed meat, recorded 1 060 cases and 216 deaths where the outcome was known, according to WHO citing NICD data. Listeria monocytogenes becomes established in drains, floors and equipment niches, and your swab results are how you find out.
For programme design, see our guides to microbiological risk assessment and environmental monitoring and FSSC 22000 clause 2.5.7.
What does a spreadsheet do well?
A spreadsheet costs little and nobody needs training to open one. Most QA teams already pay for Excel, know how to filter and chart, and can add a column in minutes when the laboratory introduces a new test. For a small site with few swabs and one careful owner, a well designed workbook is often good enough to pass an audit.
Spreadsheet programmes that work have a structured template, fixed site codes and a named person who reviews trends on a fixed date. You can buy the template; the rest is discipline.
The RA19 Environmental Monitoring Risk Assessment Template (R690, about USD 42 · EUR 37 · GBP 31 · AED 155, once off) gives you a scored Excel risk register with drop down lists, a governing procedure, a completion guide and a read me. It covers zones one to four, target organisms, sampling points and timing, action limits, trending and the five review triggers. The Automated EMP tool uses the same structure, so if you move across later you re-enter the same lines rather than redesigning the programme.
Where do spreadsheets let swab data down?
Spreadsheets tend to fail environmental monitoring in the same places: several copies of the file, no warning when a zone 1 positive arrives, trend analysis done late or not at all, repeat sites spotted by eye, review triggers forgotten, audit evidence put together by hand and formula errors nobody checks. None is an Excel bug; each is a workload problem.
Which copy is the real one?
A swab log that gets emailed around soon exists in several versions, such as the QA manager’s copy and the night shift’s. Microsoft says version history in Microsoft 365 only works for files stored in OneDrive or SharePoint. A workbook saved on a local drive and shared by email has no reliable record of who changed a result or when.
No alert when a zone 1 positive arrives
A workbook does nothing when someone types “Detected” into a cell. Unless somebody built and maintains a macro, the only alert is whoever reads the laboratory report. If that person is on leave, a Listeria monocytogenes positive on a food contact surface can sit in an inbox while the line keeps running, and your hold and release decision depends on how quickly you know.
Trend analysis done late, or not at all
Monthly trending in a spreadsheet means filters, pivot tables, charts and a written summary. In a busy month it slips, sometimes until the week before the audit, when it is too late to act on.
Repeat sites found by eye
Repeat detection at the same site is an FSSC 22000 review trigger and a strong sign of a harbourage point. In a spreadsheet you find it by scrolling, which gets harder when three people write the same drain as “Drain 3”, “D3 filler” and “Filler drain”. A pivot table counts those as three sites.
Review triggers nobody remembers
A workbook will not tell you that the last review was eleven months ago, or flag that nothing has been found. A long run of no positives is a trigger in its own right and often means the sites, timing or neutraliser need another look.
Formula errors
This is the most underrated risk. Raymond Panko’s review of spreadsheet error research, presented to the European Spreadsheet Risks Interest Group in 2000, reported that later field audits using better methods found errors in at least 86% of the spreadsheets audited, and that cell error rates across whole spreadsheets were at least 1% to 2%.
“Across these experiments, 51% of all spreadsheets contained errors, despite the fact that most spreadsheets were only 25 to 50 cells in total size.” Raymond R. Panko, Spreadsheet Errors: What We Know. What We Think We Can Do (EuSpRIG, 2000)
The research is old and your error rate will differ, but a large swab log with lookups is unlikely to be error free unless someone checks it cell by cell. In October 2020, Public Health England reported that 15 841 positive COVID-19 cases from 25 September to 2 October had been left out of daily figures because some files of positive results were larger than the loading process could handle. Press reports linked this to the older XLS Excel format, which holds at most 65 536 rows.
A filter is left on, a lookup range stops at row 500, or a positive is typed as “Positve” and never counted. The workbook shows no error message.
Let the tool check the log for you
The Automated EMP tool keeps one results log per site on the server, calculates positive rates by zone each month, lists repeat sites automatically and emails your team when a positive comes in. At R1 450 (about USD 89 · EUR 77 · GBP 66 · AED 326) per site per year, it works out to about R121 (about USD 7 · EUR 6 · GBP 6 · AED 27) a month.
What should dedicated EMP software do?
Good environmental monitoring software links the register, schedule, results and reviews so each result leads to action. At a minimum it should hold every site by zone and organism, set frequency from risk, capture results in one log, alert people about positives, detect repeats, draw trends and flag review triggers.
Use this checklist on any platform, ours included. If a vendor cannot show an item live, assume it is missing.
- Risk register built in: every site on a line with its zone, area and target organism, with inherent and residual risk scores.
- Frequency from risk: the residual score sets how often the site is swabbed.
- A real schedule: rotation across shifts and days, with the swab budget visible.
- Methods recorded: target, test method, the neutralising broth matched to the sanitiser in that area, and the laboratory.
- Graded response levels: alert, action and escalation by zone, with hold and release rules.
- One results log: date, site, zone, test, result and laboratory reference, with an import route so nobody retypes.
- Positive result alerts: emails to named people, graded by zone and stronger for repeats.
- Automatic repeat detection and trend charts by zone and area, with count results plotted against limits.
- Review triggers flagged: an annual reminder, flags for long periods with no positives and for repeats, and a log for the rest.
- Investigation support: vector sampling after a positive, root cause, corrective actions and an action tracker.
- An exit route: a full export your auditor and your successor can open without the software.
Train the people who will run it
Software only works with what your team puts in. Practical Pathogen Environmental Monitoring (EMP) and Surface Swabbing is an advanced 9 hour online course for R1 750 (about USD 108 · EUR 93 · GBP 80 · AED 394). Delegates build their own environmental monitoring risk assessment in the RA19 structure and receive an EMP package with a schedule matrix, swab log sheets, a vectoring flowchart and the RA19 procedure.
What does EMP software cost internationally?
Most dedicated environmental monitoring platforms do not publish prices: a 2026 comparison of five environmental monitoring software products lists every one of them as “contact the vendor” for pricing. The lowest published price we found for a general food safety management platform, FoodDocs, starts at USD 79 per site per month billed annually, or USD 948 per site per year before VAT.
That is the Lite plan on the FoodDocs pricing page (checked September 2026; USD 99 on monthly billing). FoodDocs covers far more than swab data, so it is a reference point rather than a like for like comparison. Where prices are not published, ask before the demonstration:
- Is the price per site, per user, per sample or per module, and is environmental monitoring included or an add on?
- Is there a separate set up, implementation or training fee?
- Can you export all your data in a readable format if you leave?
Swabs, tests, labour and investigations cost far more than software; see what an environmental monitoring programme costs in South Africa.
What does the ASC Automated EMP tool do?
The ASC Automated EMP tool is a browser based environmental monitoring programme for one site, licensed for 12 months at R1 450 (about USD 89 · EUR 77 · GBP 66 · AED 326). It covers the whole cycle, from risk register and schedule to results, alerts, trends, review triggers and an Excel export.
It runs on ascfoodsafety.com with nothing to install and saves your work to the server rather than to one laptop.
Programme design and risk register
You build register lines for each zone, site and organism. Each line gets an inherent and a residual score on a 5 x 5 matrix, and the residual rating sets the sampling frequency:
Schedule, methods and laboratory
A four week schedule matrix rotates sampling across shifts and days and shows your swab budget. You record targets, methods, the neutralising broth matched to each area’s sanitiser and your laboratory’s details. Our training site has a practical guide to sponges, swabs and neutralising broth.
Response levels, positive drill and CAPA
You set alert, action and escalation levels, with hold and release rules. After a positive, the positive drill takes you through star burst (vector) sampling around the site, then root cause analysis and corrective and preventive action. Each action goes onto the action tracker.
Results log and trend charts
Every sample is logged with date, site, zone, area, test, result and laboratory reference. You can also paste a batch of comma or tab separated rows from a spreadsheet or the laboratory’s table, and the tool fills in zone and area from the register by site code. The charts show the monthly positive rate by zone, a repeat site list, positives by area, and count results against your alert and action limits. You can use the same views for Listeria trending in ready to eat plants or Salmonella trending in dry food plants.
Positive result alert emails
Alerts go to up to ten email addresses that your site enters, as soon as a flagged result is logged. The grading rule is fixed: a pathogen detected on Zone 1 is an Action for Listeria spp. and an Escalation for Listeria monocytogenes, Salmonella or Cronobacter; Zone 2 detections are Actions; Zone 3 and 4 detections are Alerts; and a repeat at the same site within 12 months moves up one level. Counts are compared with the site’s own alert and action limits. The default aerobic plate count limits are alert above 10 and action above 100 per cm², the 100 per cm² being the food contact surface ceiling in R638 regulation 6(4)(b).
Review triggers
The tool emails a reminder when the annual review is 30 days away and again if it becomes overdue. It automatically flags a long period with no pathogen positives (by default six months with at least 20 pathogen results, both adjustable) and any site with two or more pathogen detections in 12 months. The other clause 2.5.7 (d) triggers (changes, product trends, and recalls or withdrawals) are recorded in the review log.
Export to an RA19 style workbook
The export produces an Excel workbook with sheets for How to Use, Programme Design, Risk Register, Matrices, Action Tracker, Review Log, Schedule, Targets and methods, Action levels, Positive drill and CAPA, Results Log and Trend Summary. You can download it or email it from the tool, so your auditor gets a file they can read and you keep a copy under your control.
One site, one licence, R1 450 a year
Buy the 12 month site licence, open the tool in your browser and start building your register today. There is nothing to install, and no VAT is charged at checkout. If you want a guided start, choose the first year licence with a one hour online onboarding call with an ASC consultant for R1 950 (about USD 120 · EUR 104 · GBP 89 · AED 439).
What does the tool not do?
The ASC Automated EMP tool is not a laboratory information management system (LIMS). It does not connect directly to your laboratory, it does not replace the laboratory’s report and it does not replace your food safety team’s judgement. It organises, trends and escalates the results you give it.
- Not a LIMS, no laboratory integration: it cannot order tests, run sample receipt or pull results in. Arrange analysis as you do now, then type or paste the results.
- Not the laboratory report: the laboratory’s signed report stays your primary record, and you enter its reference number in the log.
- No automatic decisions: your food safety team still decides on hold and release, root cause and what a result means.
- One login per licence holder: the site’s workspace opens under the account that bought the licence, and the alert emails keep the rest of the team informed.
- Only as good as the data: if results are missing or site names are inconsistent, the alerts and trends will be wrong.
- Laboratory competence still matters: FSSC 22000 Version 7 clause 2.5.1 (a) expects competent laboratories, shown for example by proficiency testing or ISO/IEC 17025 accreditation.
If your sites, zones or organisms are wrong, the charts will look tidy and tell you very little. Get the design right first, or ask us to check it.
Spreadsheet vs ASC tool, side by side
The spreadsheet costs less in cash and is easier to change. The ASC tool adds alerts, automatic repeat site detection, ready made trend charts, review trigger flags and a structured export, which are the jobs spreadsheet programmes most often fail at.
| Feature | Spreadsheet | ASC Automated EMP tool |
|---|---|---|
| Cash cost | Usually nothing extra if you already have Excel | R1 450 per site per year |
| Flexibility | Very high: change anything, any time | Fixed RA19 structure, which keeps the programme consistent |
| Risk register | Whatever the builder designed, often unscored | Lines per zone, site and organism with inherent and residual 5 x 5 scoring |
| Sampling frequency | Typed by hand, often not linked to risk | Set by residual rating, from daily (Critical) to twice a year (Low) |
| Master copy | Often several copies, with change history only if stored in OneDrive or SharePoint | One programme per site, saved to the server |
| Results capture | Typed or pasted into whichever copy is open | One results log, with batch paste of comma or tab separated rows |
| Positive result alert | None unless someone reads the report | Emails to up to ten addresses, graded by zone, organism and repeat detection |
| Repeat site detection | By eye or pivot table, if anyone looks | Automatic repeat site list and flag |
| Trend analysis | Built by hand, often late | Monthly positive rate by zone, positives by area, counts against limits |
| Review triggers | Depends on someone remembering | Annual reminder, automatic flags for no positives and repeats, log for the rest |
| Formula risk | High in large hand built workbooks | Calculations are built into the tool, so users do not rebuild formulas |
| Audit evidence | Put together by hand before each audit | RA19 style Excel export with twelve sheets |
| Works offline | Yes | No, it runs in the browser |
Rand amounts in this table convert at roughly USD 61, EUR 53, GBP 46 or AED 225 per R1 000 at September 2026 rates.
Where connectivity is poor, record swab details on paper and enter them later.
Total cost of ownership in hours
Staff time costs far more than the software. On the assumptions below, a site taking about 40 swabs a week could save around 87 hours of administration a year by moving from a spreadsheet to the ASC tool. At an assumed R250 (about USD 15 · EUR 13 · GBP 11 · AED 56) per hour, that is about R21 750 (about USD 1 336 · EUR 1 159 · GBP 993 · AED 4 893) in staff time, compared with a R1 450 (about USD 89 · EUR 77 · GBP 66 · AED 326) licence.
One site with about 40 swabs a week across zones 1 to 4, roughly 170 results a month. The laboratory sends results in a table that can be copied and pasted as rows. One QA officer runs the programme at an assumed fully loaded cost of R250 (about USD 15 · EUR 13 · GBP 11 · AED 56) per hour. The site has one certification audit and one customer audit a year. Excel is already licensed. Time spent responding to positives is the same for both and is not counted.
| Task (assumed hours per year) | Spreadsheet | ASC Automated EMP tool |
|---|---|---|
| Capturing results (4 hours vs 1.5 hours a month) | 48 | 18 |
| Building and reviewing monthly trends (3 hours vs 1 hour a month) | 36 | 12 |
| Finding repeat positive sites (1 hour vs 15 minutes a month) | 12 | 3 |
| Telling the right people about positives (1 hour vs 15 minutes a month) | 12 | 3 |
| Preparing the annual programme review | 8 | 3 |
| Assembling audit evidence (two audits) | 12 | 2 |
| Total hours per year | 128 | 41 |
| Staff cost at the assumed R250 per hour | R32 000 | R10 250, plus the R1 450 licence |
Rand amounts in this table convert at roughly USD 61, EUR 53, GBP 46 or AED 225 per R1 000 at September 2026 rates.
Put another way, at R250 (about USD 15 · EUR 13 · GBP 11 · AED 56) per hour the licence pays for itself once it saves about six hours in a year, less than one working day.
Two caveats: if your laboratory only sends PDF reports, capture still takes typing, and a site taking a handful of swabs a month will save far less. The table also leaves out the biggest benefit: finding a repeat positive or an overdue review before an auditor does.
Moving from a spreadsheet to the tool
Moving across takes four main jobs: transfer the register, paste in your past results, set the alert email addresses and set the review date. Run the old workbook alongside the tool for one four week cycle, then archive it.
- Clean your site listGive every sampling site one fixed code, such as “Z1 slicer blade” or “Z4 drain 03”, and correct the old log to match. Repeat detection depends on it.
- Move the registerEnter each line by zone, site and organism, score inherent and residual risk, and check that the resulting frequency fits your swab budget.
- Build the schedule and methodsSet the four week matrix, targets, methods, neutralising broth per area and laboratory details.
- Set response levelsEnter alert, action and escalation responses and your hold and release rules from your current procedure.
- Paste in your past resultsArrange past results in columns for date, site code, test, result, unit, when sampled, laboratory reference and notes, separated by commas or tabs, and paste them in. The tool checks the rows before you import them and takes each site’s zone and area from the register. Twelve months of history gives the charts and the repeat list enough data to work with.
- Set the alert emailsAdd up to ten addresses, such as the QA manager, production manager and hygiene lead, and send a test email. Make sure someone still receives alerts when one of them is on leave.
- Set the review dateSet the annual review reminder and record any trigger that is already open, such as a recent process change, in the review log.
- Run in parallel, then archiveRun both for one four week cycle and compare. Then export the RA19 style workbook as your baseline and file the old spreadsheet as read only.
Rather have us set it up for you?
Our food scientists can review your current programme, correct the zoning and site list, load your register and results history into the tool and train your team, checking the design before we transfer it.
Who should stay on a spreadsheet, and who should buy both?
Stay on a spreadsheet if you run one small site, take a handful of swabs a month and have one disciplined owner for the file. Move to the tool as swab numbers, zone 1 sampling or the number of people involved grow. Buy both RA19 and the tool if you want Word documents under document control as well as automation.
For the rest of your food safety system, ASCloud is ASC’s paperless compliance system, with digital checklists, monitoring, traceability and dashboards. The Food Safety and Quality Culture Pack is another automated tool, costing R750 (about USD 46 · EUR 40 · GBP 34 · AED 169) per site per year, with anonymous worker surveys, a management survey, a speak up channel, a dashboard and audit ready reports. Small businesses that still need their basic documents can start with the TK11 Basic Food Safety Document Templates Toolkit for R699 (about USD 43 · EUR 37 · GBP 32 · AED 157).
A floor drain that keeps testing positive is often a harbourage point where standing water and biofilm attract flies. ASC Pest Control, a SAPCA member serving Gauteng and the Eastern Cape, can inspect and treat those areas while you carry out your cleaning corrective actions. Many repeat positives are cleaning failures, so pair the programme with the Cleaning and Disinfection Risk Assessment Template (R690, about USD 42 · EUR 37 · GBP 31 · AED 155), and browse the rest in the ASC shop.
Frequently asked questions
Can I run an environmental monitoring programme in Excel?
Does FSSC 22000 require environmental monitoring software?
How much does the ASC Automated EMP tool cost?
Does the ASC tool replace my laboratory or a LIMS?
Can I import my existing swab results into the tool?
Who receives the positive result alerts?
Should I buy RA19 or the Automated EMP tool?
How often should an environmental monitoring programme be reviewed?
Key takeaways
- No standard requires software. FSSC 22000 Version 7 clause 2.5.7 requires a risk based programme, a documented procedure, trended data and at least annual review.
- A spreadsheet costs little and is easy to change, and it can work for one small site with a handful of swabs and a disciplined owner.
- Spreadsheets usually fall down on version control, positive alerts, trending, repeat sites, review triggers and formula errors.
- The ASC Automated EMP tool costs R1 450 (about USD 89 · EUR 77 · GBP 66 · AED 326) per site per year. It does not replace your laboratory, a LIMS or your team’s judgement.
- Using our illustrative assumptions, a site taking 40 swabs a week could save about 87 hours a year, and the licence pays for itself after about six hours.
- Buy the Automated EMP tool, or start with RA19 for R690 (about USD 42 · EUR 37 · GBP 31 · AED 155) if you are staying on files.
Choose how you want to manage your swab data
Buy the Automated EMP tool for R1 450 (about USD 89 · EUR 77 · GBP 66 · AED 326) per site per year, get RA19 for R690 (about USD 42 · EUR 37 · GBP 31 · AED 155) if you prefer files, train your team on the R1 750 (about USD 108 · EUR 93 · GBP 80 · AED 394) EMP course, or ask us to set everything up. ASC’s training platform has more than 3 600 course enrolments and a 4.9 average rating from 672 verified course reviews, and clients rate us 4.9 from 350+ Google reviews across our Gqeberha, Johannesburg and Cape Town offices.
Published by ASC Food Safety, South African food safety and quality consultants. This article is general guidance and not a substitute for site specific advice.