
What an Environmental Monitoring Programme Costs a South African Food Plant, Line by Line
By Mthokozisi Nkosi, Food Safety Specialist & Lead Auditor, ASC Food Safety · 25 min read
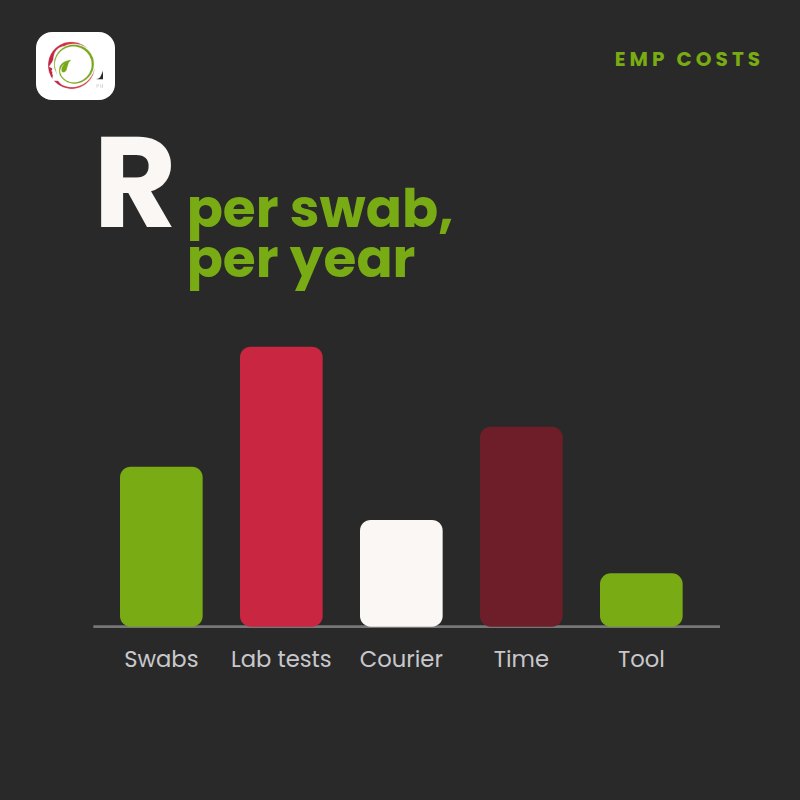
An environmental monitoring programme (EMP) costs what your own numbers multiply to: sites per sampling event, times events per month, times 12, times your laboratory’s price per test, plus materials, courier, sampler time and the follow up a positive result triggers. In the illustrative medium ready to eat plant below, laboratory tests were about 69% of an R518 110 (about USD 31 835 · EUR 27 614 · GBP 23 644 · AED 116 558) year. ASC’s Automated EMP tool (R1 450, about USD 89 · EUR 77 · GBP 66 · AED 326, per site per year) and RA19 template (R690, about USD 42 · EUR 37 · GBP 31 · AED 155) are the smallest lines and make the rest of the spend count.
At a glance
- Budget formula
- Sites per event x events per month x 12 x price per test, repeated for each zone and each test
- Biggest line
- Laboratory tests, about 69% of the worked example (illustrative prices, replace with your quote)
- Laboratory prices
- Quoted on request; budget on written quotes from at least two ISO/IEC 17025 accredited laboratories
- Where money is wasted
- Weekly pathogen tests on zone 4, swabbing only clean surfaces, composites misused, no neutraliser, results nobody trends
- Where money works hardest
- Zones 2 and 3 during production, investigative sampling after a positive, monthly trend review
- Smallest lines
- RA19 risk assessment R690 (about USD 42 · EUR 37 · GBP 31 · AED 155); Automated EMP tool R1 450 (about USD 89 · EUR 77 · GBP 66 · AED 326) per site per year; EMP course R1 750 (about USD 108 · EUR 93 · GBP 80 · AED 394)
- Scheme basis
- FSSC 22000 Version 7 clause 2.5.7, BRCGS Food Safety Issue 9 clause 4.11.8, SQF Edition 9 clause 2.4.8 (Edition 10 audits expected from 2 January 2027)
Build the budget from a risk assessment, not a guess
RA19 sets the zones, sites, organisms and frequencies every cost line depends on. The Automated EMP tool turns that register into a four week schedule with a swab budget.
Get RA19 for R690 See the EMP toolR690 is about USD 42 · EUR 37 · GBP 31 · AED 155.
In this article
- How to calculate what an EMP costs
- What drives the size of the bill
- The cost lines, one by one
- What laboratory tests cost
- Worked example: a medium ready to eat plant
- What a positive result costs
- Where EMP money is wasted
- Where the money should go
- The cost of not doing it
- The cheapest line with the biggest effect
- Building your own budget in seven steps
- Frequently asked questions
How do you calculate what an environmental monitoring programme costs?
Multiply the number of sites you swab per sampling event by the events per month, then by 12, then by your laboratory’s quoted price for that test. Do it separately for each zone and each test, then add materials, courier, sampler time, investigations after positives, training, documentation and software. That total is your annual EMP budget.
A single monthly figure with no arithmetic behind it cannot be checked. “10 zone 1 sites, weekly, for Listeria spp.” can be checked by your finance manager and by your auditor.
The core formula for each test line is:
- Annual tests = sites per event x events per month x 12
- Annual test cost = annual tests x your laboratory’s quoted price for that test
- Samples to buy = the sum of annual tests across lines, unless your laboratory runs more than one test from one sponge (ask them; it changes the materials line)
What drives the size of the bill?
Four decisions set almost the whole bill: how many sites you monitor in each zone, how often, which organisms you test for, and how many positives you find and chase. Each should come from a documented risk assessment of your product and process, which is what certification schemes and export markets expect to see.
A plant making ready to eat food that supports the growth of Listeria monocytogenes will spend more than a dry bakery, and it should.
The requirements behind the spend
FSSC 22000 Version 7 clause 2.5.7 requires a risk based environmental monitoring programme for the relevant pathogens, spoilage and indicator organisms, a documented procedure to evaluate the effectiveness of controls against contamination from the manufacturing environment, data with regular trend analysis, and a review at least annually and more often when triggers occur (FSSC 22000 Scheme Version 7). Version 7 was published in May 2026, and audits against Version 6 are allowed up to 30 April 2027 (FSSC upgrade process). Clause 2.5.1 (a) expects verification analysis to be done by a competent laboratory. BRCGS Food Safety Issue 9 clause 4.11.8 and SQF Edition 9 Food Manufacturing clause 2.4.8 also set environmental monitoring requirements; SQFI expects Edition 10 audits to start on 2 January 2027 (SQFI).
If you export, the importing market adds its own expectations. Article 5(2) of EU Regulation (EC) No 2073/2005 requires producers of ready to eat foods that may pose a Listeria monocytogenes risk to sample processing areas and equipment for L. monocytogenes, and names ISO 18593 as the reference method for that sampling (EUR-Lex). In the United States, 21 CFR 117.165(a)(3) requires environmental monitoring for an environmental pathogen or an appropriate indicator organism where contamination of a ready to eat food is a hazard requiring a preventive control, and 117.165(b)(3) requires the procedure to name the organisms, sites, timing, frequency, tests and laboratory (eCFR). That list is, in effect, your list of cost drivers.
At home, Regulation R638 of 22 June 2018 under the Foodstuffs, Cosmetics and Disinfectants Act 54 of 1972 is the food hygiene law, enforced by municipal environmental health practitioners. It does not require an environmental monitoring programme by name, but regulation 6(4)(b)(i) says a food contact surface must not carry more than 100 viable micro-organisms per cm² before food touches it, sampled with the SANS 5763 swab technique (R638, gov.za). That makes surface counts a legal line in every food plant’s budget. Codex CXG 61-2007 on the control of Listeria monocytogenes is not law in South Africa on its own, but its Annex I on environmental monitoring is a widely used reference. For design basics, read our microbiological risk assessment and EMP guide; this article stays on the money.
What are the cost lines in an EMP budget?
An EMP budget has ten recurring lines: sampling materials, laboratory tests, courier and cold chain, sampler time, investigative sampling, product hold and testing, training, documentation, software and outside expertise. The cost of not monitoring never appears on the budget until it appears on the balance sheet.
Sampling materials
Sponges suit large, uneven surfaces such as frames, floors and drains; stick swabs reach small gaps. ISO 18593:2018 describes horizontal methods for surface sampling with contact plates, stick swabs, sponges and cloths (ISO), and the EU names it as the reference method for processing area sampling. Neutralising broth is cheap insurance, as the waste section explains. Our training site has a practical surface swabbing guide on sponges, swabs and neutralising broth.
Laboratory tests
Pathogen detection gives a present or absent result per sampled area. Indicator counts such as Enterobacteriaceae or aerobic plate count show how clean a surface is and suit cleaning verification. The common reference methods are ISO 11290-1:2017 for detection of Listeria monocytogenes and Listeria spp. (ISO), ISO 6579-1:2017 for Salmonella detection (ISO), ISO 21528-2:2017 for Enterobacteriaceae colony counts (ISO) and ISO 4833-1:2013 for colony counts at 30 °C (ISO). Ask which method sits behind each price and whether it is on the laboratory’s SANAS schedule of accreditation.
A presumptive positive usually needs a separately billed confirmation. Typing of isolates, including whole genome sequencing (WGS), is an occasional line. Courier costs depend on distance and dispatch frequency, and sampler and data time are real money even when nobody invoices them.
RA19 (R690, about USD 42 · EUR 37 · GBP 31 · AED 155) gives you a scored risk register in Excel, a governing procedure, a completion guide and a read me, covering zones one to four, organisms, sampling points and timing, action limits, trending and five review triggers. Buy the RA19 template or browse all 24 risk assessment packs at R690 (about USD 42 · EUR 37 · GBP 31 · AED 155) each.
What do laboratory tests cost in South Africa?
Many South African food laboratories quote on request rather than publishing current tariffs, so a written quotation for your own tests, devices and volumes is the only price worth budgeting on. The price per test moves with the organism, the sampling device, the method, the accreditation scope, the turnaround and how many samples you send.
Published price lists date quickly, so the worked example below uses labelled assumptions rather than any laboratory’s tariff. Two quotes with similar totals can buy very different results, so compare them line by line:
| Quote item | A quote that hides cost | A quote you can budget on |
|---|---|---|
| Test named | “Listeria swab” | Listeria spp. or L. monocytogenes detection, stated separately |
| Method | Not stated | Reference or validated method named, for example ISO 11290-1 |
| Accreditation | “Accredited laboratory” | Each test shown as on or off the SANAS schedule of accreditation |
| Device | Price quoted per sample only | Price for sponge and stick swab samples, and who supplies the device and broth |
| Confirmation | Silent | Included in detection, or billed per presumptive positive |
| Logistics | Excluded without saying so | Collection or courier, sample acceptance window and turnaround in working days |
| Volume | List price | Price at your annual volume, and how long it holds |
Accreditation scope matters as much as price. FSSC 22000 clause 2.5.1 (a) expects analysis that verifies food safety to be done by a competent laboratory using validated methods, with accreditation such as ISO/IEC 17025, and a cheap result from a test outside the laboratory’s scope can cost you an audit finding.
Get written quotes from at least two ISO/IEC 17025 accredited laboratories for your exact tests, and ask how long the price holds.
Worked example: what does an EMP cost a medium ready to eat plant?
Our illustrative medium ready to eat plant runs 1 212 Listeria spp. tests, 240 Enterobacteriaceae counts and 48 Salmonella tests a year. With the assumed prices below, the programme costs R518 110 (about USD 31 835 · EUR 27 614 · GBP 23 644 · AED 116 558) a year, about R43 176 (about USD 2 653 · EUR 2 301 · GBP 1 970 · AED 9 713) a month, and laboratory tests are 69% of it. Swap in your quotes and site counts.
The plant is hypothetical: one site making chilled ready to eat products, with a high care line, a raw side and dispatch. Each “event” is one sampling round, and weekly sampling is counted as four events a month.
These are illustrative figures chosen for readable arithmetic, not market prices: Listeria spp. detection R250 (about USD 15 · EUR 13 · GBP 11 · AED 56) per sample; L. monocytogenes confirmation R200 (about USD 12 · EUR 11 · GBP 9 · AED 45); Salmonella detection R200 (about USD 12 · EUR 11 · GBP 9 · AED 45); Enterobacteriaceae count R150 (about USD 9 · EUR 8 · GBP 7 · AED 34); sponge with neutralising broth plus gloves R40 (about USD 2 · EUR 2 · GBP 2 · AED 9) per sample; product L. monocytogenes test R250 (about USD 15 · EUR 13 · GBP 11 · AED 56); courier R450 (about USD 28 · EUR 24 · GBP 21 · AED 101) per dispatch, weekly; 6 minutes of sampler time per sample at R150 (about USD 9 · EUR 8 · GBP 7 · AED 34) per hour; QA manager cost R250 per hour; 3% of Listeria spp. tests presumptive; four positive investigations a year. Replace each with your own figure.
Step 1: routine laboratory tests
| Line | Calculation | Annual tests and cost |
|---|---|---|
| Zone 1, Listeria spp., weekly | 10 sites x 4 events x 12 | 480 tests |
| Zone 2, Listeria spp., weekly | 10 sites x 4 events x 12 | 480 tests |
| Zone 3, Listeria spp., fortnightly | 8 sites x 2 events x 12 | 192 tests |
| Zone 4, Listeria spp., monthly | 5 sites x 1 event x 12 | 60 tests |
| Listeria spp. subtotal | 1 212 tests x R250 | R303 000 |
| Confirmations (assume 3% presumptive) | 1 212 x 3% = 36.36, rounded to 36, x R200 | R7 200 |
| Raw side zone 3, Salmonella, monthly | 4 sites x 1 event x 12 = 48 tests x R200 | R9 600 |
| Zone 1 Enterobacteriaceae, fortnightly | 10 sites x 2 events x 12 = 240 tests x R150 | R36 000 |
| Routine laboratory total | R303 000 + R7 200 + R9 600 + R36 000 | R355 800 |
Rand amounts in this table convert at roughly USD 61, EUR 53, GBP 46 or AED 225 per R1 000 at September 2026 rates.
Step 2: everything else
| Line | Calculation | Annual cost |
|---|---|---|
| Sampling materials | (1 212 + 48 + 240) = 1 500 routine samples x R40, plus R3 000 once off for cooler boxes, ice packs, templates and spare sponges for investigations | R63 000 |
| Courier and cold chain | 4 dispatches x 12 x R450 | R21 600 |
| Sampler time | 1 500 samples x 6 minutes = 150 hours x R150 | R22 500 |
| Data capture and trending (spreadsheet) | 8 hours a month x 12 = 96 hours x R250 | R24 000 |
| Investigative sampling | 4 events x 15 extra Listeria spp. tests = 60 x R250 (R15 000), plus 4 x 3 confirmations = 12 x R200 (R2 400) | R17 400 |
| Product hold and test | 1 event: 5 lots x 5 samples = 25 product L. monocytogenes tests x R250 (storage and disposal excluded, site specific) | R6 250 |
| Training | 2 people x R1 750 (EMP course) | R3 500 |
| Documentation | RA19 template | R690 |
| Software | Automated EMP tool, 1 site | R1 450 |
| Outside expertise | 4 hours of ASC virtual consultation x R480 for the annual review | R1 920 |
Rand amounts in this table convert at roughly USD 61, EUR 53, GBP 46 or AED 225 per R1 000 at September 2026 rates.
Step 3: the total and what it tells you
Adding the lines: R355 800 (about USD 21 862 · EUR 18 963 · GBP 16 237 · AED 80 043) + R63 000 (about USD 3 871 · EUR 3 358 · GBP 2 875 · AED 14 173) + R21 600 (about USD 1 327 · EUR 1 151 · GBP 986 · AED 4 859) + R22 500 (about USD 1 382 · EUR 1 199 · GBP 1 027 · AED 5 062) + R24 000 (about USD 1 475 · EUR 1 279 · GBP 1 095 · AED 5 399) + R17 400 (about USD 1 069 · EUR 927 · GBP 794 · AED 3 914) + R6 250 (about USD 384 · EUR 333 · GBP 285 · AED 1 406) + R3 500 (about USD 215 · EUR 187 · GBP 160 · AED 787) + R690 (about USD 42 · EUR 37 · GBP 31 · AED 155) + R1 450 (about USD 89 · EUR 77 · GBP 66 · AED 326) + R1 920 (about USD 118 · EUR 102 · GBP 88 · AED 432) = R518 110 (about USD 31 835 · EUR 27 614 · GBP 23 644 · AED 116 558) a year, or about R43 176 (about USD 2 653 · EUR 2 301 · GBP 1 970 · AED 9 713) a month. Laboratory tests are 68.7% of the total, materials 12.2%, and data capture alone is 4.6%. Training, the risk assessment, the software and the consultation together come to R7 560 (about USD 465 · EUR 403 · GBP 345 · AED 1 701), or 1.5%.
That split is the point. A plan built on a weak risk assessment, run by untrained samplers and trended by nobody still costs R355 800 (about USD 21 862 · EUR 18 963 · GBP 16 237 · AED 80 043) in laboratory fees. It just tells you less.
Let the tool build your swab budget for you
The Automated EMP tool builds the risk register in the RA19 structure, sets frequency from the residual rating (Critical daily, High weekly, Medium monthly, down to biannual for Low), and lays it out in a four week schedule matrix with shift and day rotation and a swab budget. R1 450 (about USD 89 · EUR 77 · GBP 66 · AED 326) per site per year, in the browser, nothing to install. If you would like help setting it up, the tool with a one hour online onboarding call with an ASC consultant costs R1 950 (about USD 120 · EUR 104 · GBP 89 · AED 439) for the first year.
What does a positive result cost?
A positive result costs the investigative sampling around the site, confirmation tests, any product held and tested, cold storage while it waits, and staff time for root cause and corrective action. A positive on a food contact surface costs the most because product is involved; one found early in zone 3 is cheap by comparison.
Codex CXG 61-2007 Annex I describes responses ranging from no action, through intensified cleaning and source tracing with more environmental testing, up to holding and testing product (Codex CXG 61-2007). Each step adds cost, so define alert, action and escalation levels in advance.
Investigative (star burst or vector) sampling
Sample outward from the positive site: adjacent surfaces, connected equipment, the floor and drain below, and nearby traffic routes, each tested individually. Cost it as extra samples x price per test, per round, until your clearance rule is met. We allowed 15 samples per event; a complex slicer can need more.
Hold and test
If a zone 1 positive places product on hold, you pay for product tests, cold storage, delayed dispatch and disposal of anything that fails.
Typing of isolates
When a site keeps returning positives, typing can show whether one strain has settled in or new strains keep arriving. The first can point to a harbourage point that cleaning is not reaching; the second to ingress through people, materials or traffic. Ask your laboratory about typing and its price before you need it.
Practical Pathogen Environmental Monitoring (EMP) and Surface Swabbing is an advanced, 9 hour online course at R1 750 (about USD 108 · EUR 93 · GBP 80 · AED 394). Delegates build their own RA19 style risk assessment and get a free EMP package (schedule matrix, swab log, vectoring flowchart, RA19 procedure). Enrol on the EMP course. For the root cause step, pair it with Root Cause Analysis One-Day (R1 250, about USD 77 · EUR 67 · GBP 57 · AED 281).
Where is EMP money wasted?
Money is wasted when tests are run where they cannot find anything useful: weekly pathogen tests on zone 4, swabs taken only on freshly cleaned surfaces, composites used for follow up, devices without neutraliser, and results that nobody trends. Each costs the same per test as a useful sample.
| Practice | Where the money goes to waste | What to do instead |
|---|---|---|
| Zone 4 pathogen testing | Weekly zone 4 tests: 5 sites x 4 x 12 = 240 instead of 60, an extra 180 x R250 = R45 000 | Monthly or quarterly zone 4 checks, with the saving moved into zones 2 and 3 |
| Timing | Swabbing only after cleaning, when negatives are most likely | Sample zones 1 to 3 during production, across times and shifts |
| Composites | Pooling to save, then retesting every site after a positive | Composite sparingly, never during follow up |
| Neutraliser | No effective neutraliser, risking false negatives | Broth matched to each area’s sanitiser |
| Trend review | Results reviewed only at audit time | Monthly trends by zone and repeat site |
| Static site list | The same easy sites for years | Rotate in hard to clean points |
Rand amounts in this table convert at roughly USD 61, EUR 53, GBP 46 or AED 225 per R1 000 at September 2026 rates.
Why swabbing only clean surfaces wastes money
Swab when the organism has had time to work out of harbourage points. Guidance from the Grocery Manufacturers Association says zone 1 to 3 sampling should take place at least three hours after production begins and should be varied across times and shifts (GMA, 2014). Post clean indicator swabs still verify cleaning, but that is a different purpose.
Composites: a saving that can backfire
Codex Annex I says that under certain circumstances samples can be composited without losing the required sensitivity, but a positive finding then needs more testing to locate the positive sample. GMA guidance allows up to five sponges in one sample, only in mature programmes where positives are rare, and never mixing product contact with non product contact samples. The saving disappears the moment a composite is positive.
No neutraliser, no result you can trust
A sponge picks up sanitiser residue with the bacteria, and without a neutraliser that residue can keep acting in transit. Li and colleagues described an effective environmental sampling method as one using a transport broth that neutralises sanitiser residues and keeps stressed Listeria monocytogenes cells viable; in their trial, D/E, Letheen and HiCap broths performed similarly with no quaternary ammonium compound or 400 ppm of it on the surface, but Letheen broth did not neutralise 8 000 ppm (Li et al., 2020, BMC Microbiology). The GMA guidance also says a buffer containing a neutralising agent should be used if sanitiser residues are present. Match the broth to the chemistry in each area and record it.
Paying for tests nobody trends
FSSC 22000 clause 2.5.7 (c) asks for regular trend analysis. A result sitting in a laboratory email is a paid for test that has not done its job yet.
Have an EMP specialist check where your swab budget goes
ASC’s EMP consulting team designs programmes, verifies existing ones and supports investigations after positives. Start with a virtual consultation at R480 (about USD 29 · EUR 26 · GBP 22 · AED 108) per hour.
Where should EMP money go?
Spend where the organism is most likely to be found before it reaches food: zone 2 and zone 3 sites during production, investigative sampling after every positive, and the time to review trends every month. Zone 1 testing verifies your controls; zones 2 and 3 are where you catch problems early. Budget investigations in advance, or plants re-swab only the positive site, get a negative and close the case while the harbourage point remains.
Zones 2 and 3 during production
Equipment frames, conveyor undersides, drains, floor junctions and door seals near exposed product are typical harbourage points. A positive there costs a cleaning response and some vector samples, not a product hold. Testing zones 2 and 3 for Listeria spp. as an indicator is common practice. United Fresh guidance calls Listeria spp. an appropriate indicator for L. monocytogenes, while noting a Listeria spp. finding does not mean L. monocytogenes is present (United Fresh, 2018).
Drains and harbourage
Drains are sampling sites and cleaning points, and they can also harbour pests such as drain flies and cockroaches, so a drain that keeps returning positives may need pest control and maintenance attention as well as more cleaning.
ASC Pest Control, a SAPCA member serving Gauteng and the Eastern Cape, helps food plants control drain flies, cockroaches and rodents, and helps close the harbourage points your EMP keeps finding. Talk to ASC Pest Control. For the paperwork, see our pest control risk assessment guide.
What does it cost not to run an EMP?
South Africa has a measure of it. The 2017 to 2018 listeriosis outbreak caused 1 060 cases and 216 deaths where the outcome was reported and was traced to a ready to eat processed meat product and its manufacturing environment. The manufacturer’s parent company reported R365 million (about USD 22.4 million · EUR 19.5 million · GBP 16.7 million · AED 82.1 million) in recall costs, net of insurance claims, for six months, and researchers put the wider economic cost far higher.
Those case and death figures come from WHO’s regional office for Africa, citing the NICD; the outbreak ran from its declaration on 5 December 2017 to 3 September 2018 (WHO Africa). WHO’s March 2018 outbreak notice reported that 91% of the strains were L. monocytogenes sequence type 6, found in polony, a ready to eat processed meat product, and in the manufacturer’s processing environment, and that the company and three of its retailers exported to 15 countries in the African region, all of which issued recalls (WHO).
National Institute for Communicable Diseases (NICD) whole genome sequencing work published in 2019 found that outbreak strain isolates from the Enterprise Foods production facility and its products were highly related to the clinical isolates (Smith et al., 2019). In its results for the six months to 31 March 2018, Enterprise Foods’ parent company Tiger Brands reported costs associated with the recall of R365 million (about USD 22.4 million · EUR 19.5 million · GBP 16.7 million · AED 82.1 million), net of insurance claims submitted to date and excluding ongoing trading losses (Tiger Brands interim results, 2018). A cost study in Food Control estimated fatality costs of over US$260 million, hospitalisation costs of about US$10.4 million and productivity and export losses of more than US$15 million, and did not include costs such as plant sanitisation (Olanya et al., 2019).
Set the illustrative R518 110 (about USD 31 835 · EUR 27 614 · GBP 23 644 · AED 116 558) a year against those figures. An EMP guarantees nothing, but it gives you the chance to find a harbourage point while the fix is a drain repair and a round of vector swabs.
Get an independent eye on hygiene before a regulator does
ASC’s food hygiene audits benchmark your site against R638, GMP and good hygiene practice, with a 5 star rating and Platinum, Gold, Silver or Bronze certificates, delivered nationwide from Gqeberha, Johannesburg and Cape Town.
Which EMP cost line gives the biggest return?
The software line. At R1 450 (about USD 89 · EUR 77 · GBP 66 · AED 326) per site per year, the Automated EMP tool is 0.3% of the worked example, yet it replaces the spreadsheet work of scheduling, logging, alerting and trending. If it cut data time from 8 to 3 hours a month in your plant, the time saved would be worth R15 000 (about USD 922 · EUR 799 · GBP 685 · AED 3 375) at R250 (about USD 15 · EUR 13 · GBP 11 · AED 56) an hour.
That is an illustrative assumption: 96 hours at R250 (about USD 15 · EUR 13 · GBP 11 · AED 56) is R24 000 (about USD 1 475 · EUR 1 279 · GBP 1 095 · AED 5 399), 36 hours is R9 000 (about USD 553 · EUR 480 · GBP 411 · AED 2 025), a difference of R15 000 (about USD 922 · EUR 799 · GBP 685 · AED 3 375). The bigger value is harder to price: a positive that triggers an alert email instead of sitting in an inbox, and a repeat site that shows on a chart before it shows in an audit finding.
What the tool does
- Builds the RA19 style risk register with 5 x 5 inherent and residual scoring, and sets frequency and a four week, shift rotated schedule with a swab budget
- Sets alert, action and escalation levels, hold and release rules, a star burst (vector) positive drill, CAPA and an action tracker
- Logs every result (date, site, zone, test, result, lab reference), with CSV paste import
- Draws trend charts: monthly positive rate by zone, repeat site list, positives by area, and count results against your own alert and action limits (aerobic plate count defaults: alert above 10 and action above 100 per cm², the R638 ceiling)
- Grades each result as it is saved and emails flagged results to up to ten addresses: a pathogen on zone 1 is an Action for Listeria spp. and an Escalation for Listeria monocytogenes, Salmonella or Cronobacter; zone 2 detections are Actions; zone 3 and 4 detections are Alerts; a repeat at the same site within 12 months moves up one level
- Reminds you of the annual review, flags long runs without positives and repeat detections, and logs other clause 2.5.7 (d) triggers
- Exports an RA19 style Excel workbook for auditors
Compare it with spreadsheets in EMP software vs spreadsheet, and see common EMP audit nonconformities.
ASCloud, ASC’s paperless compliance system, puts digital checklists, monitoring, traceability and dashboards in one place. Explore ASCloud. Still building the basic system? The TK11 Basic Food Safety Document Templates Toolkit (R699, about USD 43 · EUR 37 · GBP 32 · AED 157) gives you the core documents.
How do you build your own EMP budget?
Start from the risk assessment, count sites and frequencies per zone, get written laboratory quotes, then run the formula for each test line. Add materials, courier and people time, set aside money for investigations and holds, and review the budget against your trend data every year.
- Complete the risk assessmentScore each zone, site and organism with RA19 or the Automated EMP tool.
- Fix the site list and frequencyRecord sites per event and events per month for every zone and test.
- Get two written quotesFrom ISO/IEC 17025 accredited laboratories, per test, per device, with confirmation, courier and turnaround stated.
- Run the formulaSites x events x 12 x price for each line, checked by a second person.
- Add the hidden linesMaterials, cold chain, sampler hours, data hours, training, documentation and software.
- Ring fence investigationsEstimate positives from your history and cost what each would trigger.
- Review with the dataAt the annual review, move money to the sites that matter and record why.
Frequently asked questions
How much does an environmental monitoring programme cost in South Africa?
How much does a Listeria swab test cost?
Is it cheaper to composite environmental swabs?
Do my sponges need neutralising broth?
Should I test for Listeria spp. or Listeria monocytogenes?
What does a positive Listeria result cost?
Is environmental monitoring a legal requirement in South Africa?
What does the ASC Automated EMP tool cost?
Key takeaways
- Budget each test line as sites per event x events per month x 12 x your laboratory’s quoted price, then add materials, courier, people time and investigations.
- In the illustrative medium ready to eat plant, the programme came to R518 110 (about USD 31 835 · EUR 27 614 · GBP 23 644 · AED 116 558) a year, with laboratory tests at 68.7% of the total.
- Many South African laboratories quote on request; compare at least two written quotes line by line for method, accreditation scope, confirmation and turnaround.
- Move spend away from weekly zone 4 pathogen tests and post clean only swabbing, and towards zones 2 and 3 during production, vector sampling and trend review.
- The 2017 to 2018 listeriosis outbreak, with 1 060 cases and 216 deaths where the outcome was reported (WHO, citing NICD), shows the cost of not finding a harbourage point.
- Make the smallest line work hardest: get the Automated EMP tool for R1 450 (about USD 89 · EUR 77 · GBP 66 · AED 326) per site per year.
Turn your swab spend into evidence you can defend
Our training platform has recorded more than 3 600 course enrolments and a 4.9 average rating from 672 verified course reviews, our clients rate us 4.9 from 350+ Google reviews across our Gqeberha, Johannesburg and Cape Town offices, and the KFC and Spur franchise groups train their teams with ASC. Get the risk assessment, tool, training and specialist review in one place.
Published by ASC Food Safety, South African food safety and quality consultants. This article is general guidance and not a substitute for site specific advice.