
How to Measure Food Safety Culture: A Practical Guide for FSSC 22000, BRCGS, SQF and IFS Sites
By Mthokozisi Nkosi, Food Safety Specialist & Lead Auditor, ASC Food Safety · 16 min read
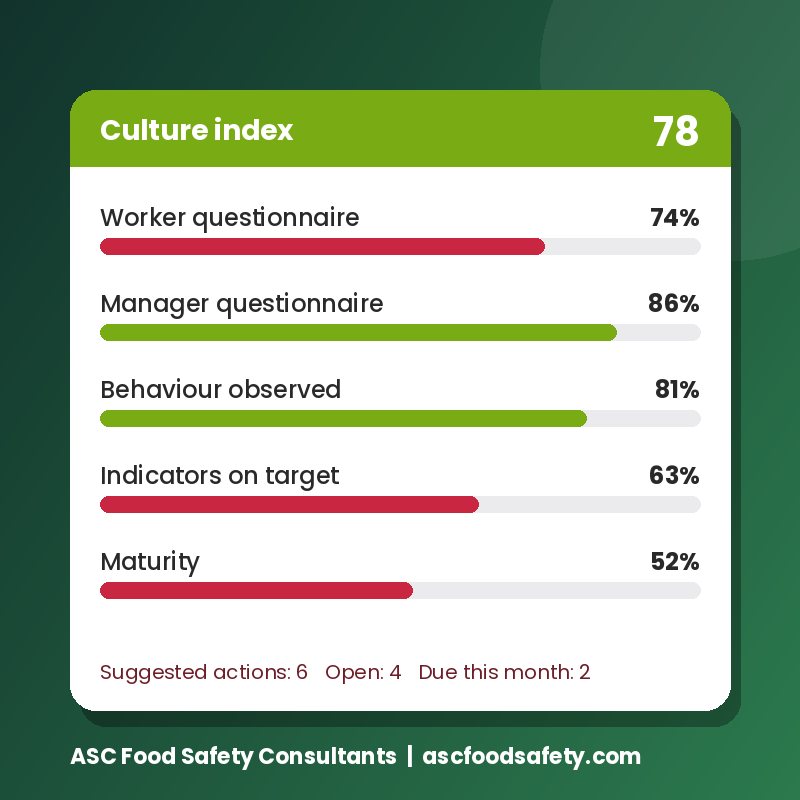
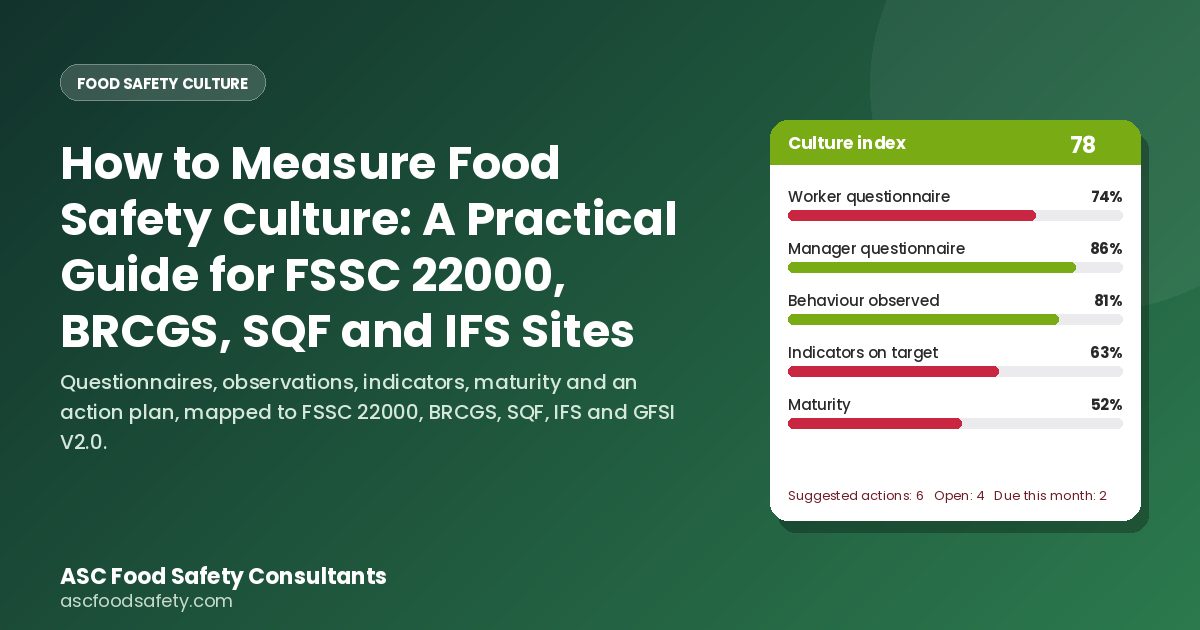
Every GFSI benchmarked scheme now asks a site to show how it measures its food safety and quality culture, what it found and what it did about it. This guide sets out the method ASC uses on client sites: an anonymous questionnaire for workers and one for managers, behavioural observations and GMP inspections by department, sixteen lead and lag indicators, a maturity assessment scored from records, and one action plan with owners and due dates. The Food Safety and Quality Culture Pack runs the whole method in a browser for R750 per site per year.
At a glance
- Who asks for it
- FSSC 22000 clause 2.5.8, BRCGS Food Safety Issue 9 clause 1.1.2, SQF Edition 9 clause 2.1.1 and IFS Food Version 8 clauses 1.1 and 1.2, plus the GFSI benchmarking requirements behind all four
- What they want
- Evidence of measurement, an action plan with owners and dates, review at management review, and a trend from one round to the next. A signed policy and a poster do not answer the clause
- Four sources of evidence
- Perception (anonymous questionnaires), behaviour (observations and GMP inspections), performance (lead and lag indicators) and maturity (a criteria based self assessment)
- The framework
- The four FSSC 22000 elements (communication, training, feedback and engagement, performance measurement) and the five dimensions of the GFSI position paper A Culture of Food Safety Version 2.0 (2026)
- The numbers that matter
- 80 percent participation, 80 percent favourable per statement, groups of five or more, results back to the floor within 30 days, next round in six or twelve months
- The tool
- Food Safety and Quality Culture Pack, R750 per site for 12 months, anonymous questionnaires on a QR code, dashboard, suggested actions and a one click audit ready report
Measure it once, properly, and the clause stops being a finding
The culture pack gives you the questionnaires, the QR posters, the dashboard and the report. Buy it today, put the posters up tomorrow, and table the first report at your next management review.
Buy the Food Safety and Quality Culture Pack, R750 per site per year See how the pack works
In this guide
- Why every scheme now asks you to measure culture
- The model: four sources of evidence, one plan
- What the GFSI position paper Version 2.0 changed in 2026
- Running an anonymous questionnaire people actually answer
- Behavioural observation and GMP inspections per department
- Lead and lag indicators that show culture moving
- The maturity assessment, scored from records rather than hope
- Turning the results into objectives and an action plan
- What the auditor will ask for, and the evidence map
- Seven mistakes that turn a culture programme into a poster
- Spreadsheet, consultant, software or the culture pack
- Frequently asked questions
Why every scheme now asks you to measure culture
Ten years ago food safety culture was a conference topic. Today it is a clause, and the clause has teeth. The GFSI Benchmarking Requirements made a culture element mandatory for every recognised scheme, and the schemes wrote it into their standards in language that asks for evidence rather than intention. That is the part sites keep missing. The auditor is not checking whether you believe in culture. The auditor is checking whether you can show, with dated records, that you measured it, that you set objectives, that somebody owns the actions, and that senior management reviewed the lot.
The wording differs from scheme to scheme, but the expectation does not.
| Scheme | Clause | What it asks for | What the auditor writes up |
|---|---|---|---|
| FSSC 22000 | 2.5.8 Food safety and quality culture | Senior management commitment, culture objectives in the policy, and a plan covering communication, training, feedback from employees and performance measurement, reviewed at management review | No evidence of measurement, objectives with no baseline or target, a plan with no dates, no record of review |
| BRCGS Food Safety Issue 9 | 1.1.2 Culture plan | A clear plan for the development and continuing improvement of food safety and quality culture, with defined activities involving all sections of the site, timescales, and a review of effectiveness at least annually | A plan that is a poster, activities with no timescale, no measure of effectiveness, no evidence that all sections were involved |
| SQF Edition 9 | 2.1.1 Management commitment | Senior site management to lead and maintain a food safety culture, with policy, objectives, communication and resources, and evidence that the culture is measured and reviewed | Policy signed, nothing measured, no objectives that a person could be held to |
| IFS Food Version 8 | 1.1 and 1.2 Policy and corporate structure | Food safety culture elements (communication, training, employee feedback and performance measurement) documented and reviewed by senior management | Elements listed with no evidence that feedback was collected or performance was measured |
Read the four together and the method writes itself. You need a way to hear from employees (feedback), a way to know what people can do (training and competence), a way to see what people do (behaviour), a way to know how the site performs (measurement), and a plan that links all of it to named people and dates. Then you need to do it again and show the difference.
A site has a culture survey from two years ago, a folder of posters and a policy signed by the managing director. There is no action plan, no second round and no record that management ever discussed the results. The auditor raises a minor against the culture clause and the site spends the next three months building what it should have built in the first place. Every step in this guide is there to prevent that finding.
The model: four sources of evidence, one plan
Culture is a set of shared beliefs that shows up as behaviour. You cannot measure the beliefs directly, so you triangulate. Ask people what they think, watch what they do, count what the site produces, and score how mature the system behind it is. When all four agree you have a reliable picture. When they disagree you have found something worth investigating, which is usually the most valuable output of the whole exercise.
The plan sits on top. Every flagged questionnaire statement, every indicator off target, every maturity criterion at level 1 or 2, every behaviour under 80 percent compliance and every competency gap becomes a candidate action with an owner, a due date, a timeframe and an effectiveness check. Two to four culture objectives, written with a baseline and a target, hold the plan together and give the management review something to review.
If you cannot say what the number was, what it is now and who moved it, you have not measured culture. You have described it.
What the GFSI position paper Version 2.0 changed in 2026
The original GFSI position paper, A Culture of Food Safety (2018), gave the industry five dimensions: vision and mission, people, consistency, adaptability, and hazards and risk awareness. Version 2.0, published in 2026, keeps the substance and reorganises it into a model that is easier to build a questionnaire on. Two organisational culture foundations sit underneath, and three manifested cultural essentials sit on top.
| GFSI V2.0 dimension | What it covers | How it shows up in a questionnaire |
|---|---|---|
| Company values, vision and mission (foundation) | Food safety written into what the business says it is for, and visible in decisions when cost and safety collide | “When there is a choice between output and food safety, food safety wins here.” “Senior managers talk about food safety, not only about volume.” |
| People: commitment, empowerment and accountability (foundation) | People at every level know their role, have the authority to act, and are held to account fairly | “I can stop the line if I see a food safety problem, and I will not be blamed for it.” “People who cut corners are dealt with the same way whoever they are.” |
| Hazard and risk awareness (essential) | People understand the hazards at their own station and why the controls exist | “I can explain what could go wrong at my station and what I do to prevent it.” |
| Consistency for food safety (essential) | Controls are followed the same way on every shift, under pressure, with the resources to do so | “Night shift works to the same standard as day shift.” “I have the equipment and time to do the checks properly.” |
| Adaptability, change and continuous improvement (essential) | The site learns from near misses, complaints and audits, and changes what it does | “When something goes wrong we find the cause and fix it, rather than finding someone to blame.” |
Version 2.0 also takes a position on maturity models: it describes them as useful management tools but outside GFSI’s scope, which is why the method here treats the maturity assessment as your own evidence rather than a GFSI requirement. Map every statement in both questionnaires to one GFSI dimension and one FSSC 22000 element, and one dataset answers every framework an auditor might bring.
The worker and manager questionnaires in the culture pack carry sixteen statements each. Each statement is tagged with an FSSC 22000 element (commitment, communication, training, feedback, performance measurement) and a GFSI V2.0 dimension, so the dashboard reports results both ways without a second survey. Sites certified to BRCGS or SQF get the same report with the clause references swapped.
Running an anonymous questionnaire people actually answer
The questionnaire is the part everyone has tried and most sites have got wrong. The failure is rarely the statements. It is the method: a paper form handed out by the supervisor, collected by the supervisor, with a name box at the top. The scores come back at 9 out of 10 across the board and the exercise proves nothing.
Design
- Sixteen statements, no more. People answer on their phones, standing up, in five minutes. Long surveys are abandoned at question twenty.
- A 1 to 10 agreement scale. Report the percentage of people scoring 7 or higher as the favourable score for each statement. Percent favourable is easier to act on than an average of 6.8.
- One reverse scored statement, for example “There are food safety problems here that management has not been told about.” A high score on that statement is a finding on its own.
- One optional free text comment. Say plainly that people must not write their names in it.
- Optional grouping questions only: department, shift, employment type (permanent, agency, seasonal, contractor), tenure and home language. No name, employee number, email or device identifier.
- A parallel questionnaire for managers and supervisors covering commitment, resources, work pressure, coordination between departments, coaching, just culture and measurement, so the gap between what managers believe and what workers experience can be reported by element.
Method
- Tell people why, before the round opensAt every shift meeting: the questionnaire is anonymous, results are reported for groups only, results will be shared within 30 days, and the point is to fix what is not working. Say who will see the raw data (nobody on the floor).
- Use a QR code and a link, not paperOne QR poster for workers, one for managers and supervisors, one for anonymous feedback, on every notice board and in every WhatsApp group. People answer on their own phones, away from the supervisor.
- Reach the people paper never reachesNight shift, agency and seasonal staff, contractors and drivers. Put a tablet at the shift meeting for people without data. A bilingual supervisor reading the statements aloud to a group is acceptable; a supervisor watching people answer is not.
- Set the participation target at 80 percentTrack it daily and chase the departments that are behind. A department with 30 percent participation has told you something about its culture already.
- Close the round and report within 30 daysThree lowest statements, the action on each and the owner, on every shift board. If people never see what their answers changed, the next round will get half the responses.
Reading the results
Any statement under 80 percent favourable is flagged. Look at the flagged statements by department and by shift before you look at the site average, because a site average of 82 percent can hide a night shift at 55. Then look at the perception gap: where managers score an element 25 points higher than workers, the managers are working from a picture that does not match the floor, and that gap is usually the first objective on the plan. Finally, read every comment. Ten comments about the same broken hand wash station are worth more than any score.
Behavioural observation and GMP inspections per department
Questionnaires tell you what people believe. Observation tells you what they do when they think nobody is scoring them. You need both, because the two disagree more often than you would expect, and the disagreement is where the culture actually lives.
Three record types do the work. The first is the GMP and hygiene inspection you almost certainly already run, scored per department so that the score can be trended and compared. The second is the behavioural observation walk: a 20 minute walk through one department, counting the people seen and the people compliant for a defined list of behaviours. The third is the senior management floor walk, logged by date, area, what was seen and what was done about it, because senior management commitment has to be evidenced and a diary entry is the cleanest evidence there is.
| Behaviour observed | Why it is on the list | Target |
|---|---|---|
| Hand washing on entry and after the defined triggers | The most basic control and the most often skipped under pressure | 95 percent or more of people observed |
| Allergen changeover completed and signed before the next run starts | The single most common cause of recalls in South Africa and abroad | 100 percent |
| Line clearance done and recorded before start up | Catches mixed packaging and wrong labels before they leave | 100 percent |
| Checks recorded at the stated time, not filled in at the end of shift | A record written at 14:00 for a check due at 10:00 is a false record | 90 percent or more |
| The person can explain the hazard at their station and what they do about it | Hazard and risk awareness, GFSI V2.0 dimension three | 80 percent or more |
| The person knows they can stop the line and who to call | Empowerment, GFSI V2.0 foundation two | 90 percent or more |
| Correct protective clothing and no jewellery, with no exceptions for visitors and managers | Consistency, and whether the rules apply to everyone | 95 percent or more |
| Foreign body controls in place (knife, glass, brittle plastic checks current) | The controls that fail quietly | 100 percent |
Vary the time of day, include night shift and weekends, and rotate the observer. Report compliance by behaviour and by department. Any behaviour under 80 percent compliance becomes an action, and the action is almost never “retrain”: it is usually a broken sink, a missing scale, a changeover allowance that does not fit the production plan, or a supervisor who has been told to get the numbers out.
Lead and lag indicators that show culture moving
Performance measurement is the element sites find hardest to evidence, mostly because they try to invent culture specific metrics rather than using what the food safety system already produces. Sixteen indicators are enough. Review them monthly, plot twelve months, set a target for each, and expect the ones that count reports to rise before the ones that count failures fall.
When a speak up channel starts working, the number of concerns raised goes up. When near miss reporting is encouraged, near misses go up. For two or three quarters the lead indicators will look like the site is getting worse. Write a one page note before the first report explaining that a rising count of reports is the programme working, have the site head sign it, and file it with the first report. Otherwise the second management review will read improvement as deterioration and cut the programme.
The maturity assessment, scored from records rather than hope
A maturity assessment is a structured self audit against written descriptors. Twelve criteria are enough: leadership visibility, resources, communication, training and competence, feedback and speak up, just culture, hazard awareness, consistency across shifts, learning from failure, measurement, supplier and contractor inclusion, and management review. Each is scored 1 to 5 with descriptors written for levels 1, 3 and 5 and an evidence field beside the score.
The rule that makes it useful: score from records. Level 3 for leadership visibility means the floor walk log shows a senior manager on the floor at least weekly, with an entry for what was seen and what was done. If the log does not exist, the score is 1, however visible the managing director feels. Most sites start at levels 1 and 2 across the board, and an honest 2 that becomes a 3 next year is worth far more at audit than a flattering 4 that stays a 4.
Turning the results into objectives and an action plan
This is where the clause is actually answered, and it is the section the auditor turns to first. Two things are needed: culture objectives written in a form that can be measured, and an action plan that links every piece of evidence to a named person and a date.
Objectives in the eight part format
Write two to four objectives, no more, each with: the objective, the baseline (the number from this round), the target (the number for next round), the measure (which statement, indicator or score), the owner, the deadline, the sections of the site reached, and the review date. “Improve communication” is not an objective. “Raise the favourable score on ‘I am told about food safety problems that affect my work’ from 61 percent to 80 percent across all shifts by the September 2027 round, owner: production manager, reviewed at each quarterly management review” is.
The action plan
- One line per action, each traceable to its evidence: the statement, the indicator, the observation or the maturity criterion that produced it.
- Owner by name, due date, and a timeframe category (30, 60, 90 days or next round) so the plan can be sorted by urgency.
- Status tracked to closure, with the evidence of completion recorded (a photo of the new sink, the training register, the revised changeover procedure).
- An effectiveness check after closure: did the number move? An action that closed on time and changed nothing is a lesson, not a success.
- Tabled at management review with the objectives, the indicators and the questionnaire results, and minuted.
The pack drafts the action plan for you
Every flagged statement, every indicator off target, every maturity criterion at level 1 or 2, every behaviour under 80 percent and every competency gap is turned into a suggested action with a timeframe. You accept the ones you agree with, set the owner and the date, and close each one with evidence and an effectiveness check.
Buy the culture pack, R750 per site per year Or train your team on the FS320202 culture course
What the auditor will ask for, and the evidence map
An experienced auditor works through the culture clause in a fixed order, and the order is worth knowing because it is the order your file should follow.
- Show me the policy and the objectivesThe policy names food safety and quality culture. The objectives have baselines, targets, owners and dates. The objectives were set by senior management, and the management review minutes say so.
- Show me how you measuredThe questionnaire method, the participation figures by department, the results by statement and element, the observation records, the indicator dashboard and the maturity assessment with its evidence fields.
- Show me what you did about itThe action plan with owners, dates and status, the evidence of closure, and the effectiveness checks. This is the section that decides between a conformance and a minor.
- Show me that all sections were involvedParticipation and results by department, shift and employment type, including agency and contractors. BRCGS 1.1.2 uses the words “all sections of the site” deliberately.
- Show me the review and the trendManagement review minutes discussing the results, and the previous round for comparison. A site with one round has a baseline; a site with two has a culture programme.
An evidence map, a one page table listing each clause requirement against the section of the report that answers it, saves twenty minutes of the audit and signals that the site knows what it is doing. The culture pack report carries one as section 12.
Seven mistakes that turn a culture programme into a poster
- Asking for names. The moment a questionnaire can be traced, it measures fear rather than culture.
- Surveying only the day shift and the permanent staff. The people you did not ask are the people the auditor will talk to.
- Reporting a site average. Averages hide the department that needs the help. Report by department, shift and employment type, groups of five or more.
- Never feeding results back. A round with no feedback trains people that answering is pointless. Participation halves next time.
- Actions with no owner or date. “Improve communication” belongs on a poster. The plan needs names and dates.
- Treating rising near miss reports as deterioration. Write the note, sign it, file it.
- One round and done. Culture is a trend, not a snapshot. Book the next round before you close this one.
Spreadsheet, consultant, software or the culture pack
There are four ways to run this. All four can pass an audit. They differ in cost, in how much of your QA manager’s month they consume, and in whether the second round can be compared with the first.
| Option | What it costs | What it takes from your team | Where it falls down |
|---|---|---|---|
| Paper questionnaire and a spreadsheet | Nothing in cash | Two to three days per round to collect, capture and chart, plus building the report by hand | Anonymity is hard to prove, capture errors, no dashboard, the second round is rarely comparable with the first |
| Consultant led survey | R15,000 to R60,000 per round in South Africa, depending on site size and whether workshops are included | Little, which is the attraction | Expensive to repeat, the data lives with the consultant, and the action plan needs the site to own it anyway |
| Enterprise culture software | Typically priced per employee per year in US dollars, with onboarding fees | IT involvement, single sign on, procurement | Built for multinationals; a 150 person site in Gqeberha does not need it and cannot justify it |
| ASC Food Safety and Quality Culture Pack | R750 per site per year, about USD 44, renewable | Fifteen minutes of setup, then the round runs itself; the report is one click | One site per licence; group sites buy one pack each. It measures and reports; it does not run the workshops for you, although ASC can |
The pack exists because the first three options kept failing the same way on client sites: the measurement was done once, badly, and never repeated. A tool that costs less than one hour of consulting time removes the excuse. Everything in this guide, the two questionnaires, the feedback link, the observation and inspection records, the sixteen indicators, the twelve maturity criteria, the eight part objectives and the action plan, is built into it, and the report it produces is the file the auditor asks for.
Frequently asked questions
What does it mean to measure food safety culture?
Which clauses require food safety culture to be measured?
How often should a food safety culture survey be run?
Does the questionnaire have to be anonymous?
How many responses do I need for the results to mean anything?
What is the difference between a lead indicator and a lag indicator in food safety culture?
Can we use the GFSI culture position paper as the framework?
Is there a tool that does this without building spreadsheets?
Key takeaways
- FSSC 22000 2.5.8, BRCGS 1.1.2, SQF 2.1.1 and IFS 1.1 and 1.2 all ask for evidence that culture was measured, acted on and reviewed. A policy and a poster do not answer any of them.
- Measure from four sources: anonymous questionnaires (workers and managers separately), behavioural observations and GMP inspections per department, sixteen lead and lag indicators, and a maturity assessment scored from records.
- Map every statement to the four FSSC 22000 elements and the five GFSI Version 2.0 dimensions, and one dataset answers every scheme.
- Anonymity, 80 percent participation, results by department and shift, feedback within 30 days, and a second round are what separate a programme from a survey.
- The action plan is the audit evidence: owners, dates, evidence of closure and an effectiveness check, tabled at management review.
- The Food Safety and Quality Culture Pack runs the whole method in a browser for R750 per site per year, with the report the auditor asks for produced in one click.
Your next audit is closer than your next culture round
Buy the pack, print the posters, and have the first report on the table at your next management review. If you would rather ASC ran the first round, presented the findings to management and wrote the culture plan, say so on the contact form and mention the culture pack.
Buy the Food Safety and Quality Culture Pack, R750 per site per year Ask ASC to run the first round for you
Published by ASC Food Safety, South African food safety and quality consultants. This article is general guidance and not a substitute for certification-specific advice.